SVG 中的路径元素 <path> 是最复杂的元素,也是最强大的元素。在图形绘制中,SVG 提供的基础元素往往不能完全满足需求,此时就需要使用路径元素了,通过路径元素的各种命令,可以实现任何想要的形状。这篇文章就来讲一讲路径元素的相关知识。
相对坐标与绝对坐标
在正式学习路径元素前,有两个概念需要先理解清楚,即相对坐标与绝对坐标。路径元素的路径数据由一个个命令加参数的组合组成(后文会详细讲解),命令分大写字母和小写字母两种,大写字母后面的参数坐标表示的是绝对坐标,即始终以当前坐标系的左上角为坐标原点;小写字母后面的参数坐标表示的是相对坐标,即始终以上一个点的坐标作为新的坐标原点。来看两个例子:
<svg width="200" height="200" xmlns="http://www.w3.org/2000/svg" version="1.2" style="border: solid 1px #00b38a">
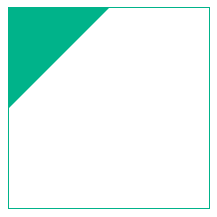
<path d="M 0 0 L 100 0 L 0 100 Z" fill="#00b38a"/>
</svg>
第 2 行路径数据的命令(属性 d 中的代码)都是大写字母,后面的坐标表示的都是绝对坐标,因此上述路径数据用文字描述就是:
- 移动到坐标
(0,0)处 - 画一条直线到坐标
(100,0)处 - 画一条直线到坐标
(0,100)处 - 闭合路径
得到的图案如下:
如果我们将代码中的字母都换成小写:
<svg width="200" height="200" xmlns="http://www.w3.org/2000/svg" version="1.2" style="border: solid 1px #00b38a">
    <path d="m 0 0 l 100 0 l 0 100 z" fill="#00b38a"/>
</svg>
得到的图案如下:

可以看到两者效果差别很大,当命令是小写字母时,其后面的坐标表示的是相对坐标,是以上一个点的坐标为坐标原点的,因此上述路径数据用文字描述就是:
- 移动到坐标
(0,0)处 - 画一条直线到坐标
(100,0)处 - 以坐标
(100,0)为原点,画一条直线到坐标(0,100)处;换算成以当前坐标系左上角为坐标原点(即绝对坐标模式),则为画一条直线到坐标(100,100)处 - 闭合路径
明确相对坐标与绝对坐标之间的区别是非常重要的,如果有一个路径数据的大小写写错了,得到的结果可能会是天壤之别。
属性
此处讲解的属性都是路径元素独有的属性,其他属性如 stroke 等可以阅读对应文章。
d
d 属性是路径元素最重要的属性,它的值(即路径数据)决定了如何绘制图案,也是本文讲解的重点。
前文说过,路径数据由一个个命令加参数的组合组成,之所以说命令加参数,是因为有些命令的参数不仅仅有坐标。
在深入讲解这些命令前,我们先来了解一下路径数据的书写方式。
书写方式
SVG 提供了简洁而相对灵活的语法,命令用一个字母表示,参数直接跟在命令的后面,它会智能的消除多余的空格和分隔符,沿用之前的例子:
<svg width="200" height="200" xmlns="http://www.w3.org/2000/svg" version="1.2" style="border: solid 1px #00b38a">
    <path d="M 0 0 L 100 0 L 0 100 Z" fill="#00b38a"/>
</svg>
上面的路径数据中可以去掉命令和参数之间的空格:
<svg width="200" height="200" xmlns="http://www.w3.org/2000/svg" version="1.2" style="border: solid 1px #00b38a">
    <path d="M0 0L100 0L0 100Z" fill="#00b38a"/>
</svg>
也可以将坐标之间的空格替换为逗号增加易读性:
<svg width="200" height="200" xmlns="http://www.w3.org/2000/svg" version="1.2" style="border: solid 1px #00b38a">
    <path d="M0 0L100 0L0 100Z" fill="#00b38a"/>
</svg>
还可以在连续多次使用同一命令时,在后续命令中消除该命令字母:
<!--去掉了第三个命令字母 L-->
<svg width="200" height="200" xmlns="http://www.w3.org/2000/svg" version="1.2" style="border: solid 1px #00b38a">
    <path d="M 0 0 L 100 0 0 100 Z" fill="#00b38a"/>
</svg>
虽然有这么多的便利性,但我个人觉得易读性应该是最重要的。
moveto
| 命令 | 参数 | 描述 |
|---|---|---|
| M 或 m | (x y)+ | 移动到一个新的点 |
此命令相当于将画笔移动到一个点上,但未下笔。在任意路径数据中,第一个命令必须是此命令(肯定的啊,要用画笔作画,就一定要先将画笔移动到画板上吧)。
<!--第一个命令不是 M 或 m,无效路径数据-->
<svg width="200" height="200" xmlns="http://www.w3.org/2000/svg" version="1.2" style="border: solid 1px #00b38a">
    <path d="L 100 0 L 0 100 Z" fill="#00b38a"/>
</svg>
它后面的参数为点的坐标 (x,y),可以有多对。
当出现多对坐标时,如果是 M,则将对随后的坐标隐式应用 L 命令,沿用之前的例子:
<svg width="200" height="200" xmlns="http://www.w3.org/2000/svg" version="1.2" style="border: solid 1px #00b38a">
    <path d="M 0 0 100 0 0 100 Z" fill="#00b38a"/>
</svg>
得到的图案如下:
如果是 m,则对随后的坐标隐式应用 l 命令,沿用之前的例子:
<svg width="200" height="200" xmlns="http://www.w3.org/2000/svg" version="1.2" style="border: solid 1px #00b38a">
    <path d="m 0 0 100 0 0 100 Z" fill="#00b38a"/>
</svg>
得到的图案如下:
lineto
| 命令 | 参数 | 描述 |
|---|---|---|
| L 或 l | (x y)+ | 从当前点绘制一条直线到指定点 |
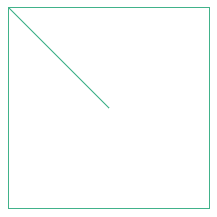
此命令用于从当前点到指定点 (x,y) 绘制一条直线:
<svg width="200" height="200" xmlns="http://www.w3.org/2000/svg" version="1.2" style="border: solid 1px #00b38a">
    <path d="M 0 0 L 100 100" stroke="#00b38a" stroke-width="1"/>
</svg>
得到的图案如下:
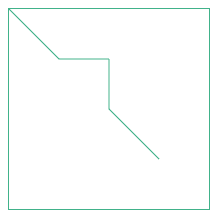
如果指定了多个点坐标,则依次在相邻两个点间绘制直线:
<svg width="200" height="200" xmlns="http://www.w3.org/2000/svg" version="1.2" style="border: solid 1px #00b38a">
    <path d="M 0 0 L 50 50 L 100 50 L 100 100 L 150 150" stroke="#00b38a" fill="none" stroke-width="1"/>
</svg>
得到的图案如下:
horizontal lineto
| 命令 | 参数 | 描述 |
|---|---|---|
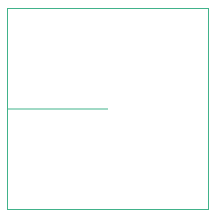
| H 或 h | x+ | 从当前点绘制一条水平直线到指定点 |
此命令只需要指定结束点的横坐标即可:
<svg width="200" height="200" xmlns="http://www.w3.org/2000/svg" version="1.2" style="border: solid 1px #00b38a">
    <path d="M 0 100 H 100" stroke="#00b38a" fill="none" stroke-width="1"/>
</svg>
得到的图案如下:
它也可以接收多个横坐标,但是并没有意义,因为它绘制的始终是一条水平直线,所以结束点的横坐标就是最后一个横坐标。
vertical lineto
| 命令 | 参数 | 描述 |
|---|---|---|
| V 或 v | x+ | 从当前点绘制一条垂直直线到指定点 |
此命令只需要指定结束点的纵坐标坐标即可:
<svg width="200" height="200" xmlns="http://www.w3.org/2000/svg" version="1.2" style="border: solid 1px #00b38a">
    <path d="M 100 0 V 100" stroke="#00b38a" fill="none" stroke-width="1"/>
</svg>
得到的图案如下:
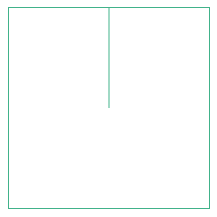
它也可以接收多个纵坐标,但是并没有意义,因为它绘制的始终是一条垂直直线,所以结束点的横坐标就是最后一个纵坐标。
closepath
| 命令 | 参数 | 描述 |
|---|---|---|
| Z 或 z | (none) | 闭合路径 |
此命令从当前点自动绘制一条直线到整条路径的起始点,它没有参数,因此大写或是小写效果都是一样的。沿用之前的例子:
<svg width="200" height="200" xmlns="http://www.w3.org/2000/svg" version="1.2" style="border: solid 1px #00b38a">
    <path d="M 0 0 L 100 0 L 0 100 z" fill="#00b38a"/>
</svg>
将 Z 改为小写,得到的图案是一样的。
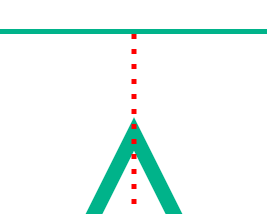
需要注意的是,使用此命令闭合路径与使用 L 或 l 画一条直线到起始点以闭合路径的方式在表现上略有不同。来看两个例子:
<svg width="200" height="200" xmlns="http://www.w3.org/2000/svg" version="1.2" style="border: solid 1px #00b38a">
    <path d="M 100 20 L 180 180 L 20 180 Z" stroke="#00b38a" stroke-width="3" fill="none"/>
    <path d="M 100 0 L 100 200" stroke="red" stroke-width="1" stroke-dasharray=""/>
</svg>
当使用 Z(或 z)命令闭合路径时,末端形成的是一个尖角:
而使用 L 或 l 命令时:
<svg width="200" height="200" xmlns="http://www.w3.org/2000/svg" version="1.2" style="border: solid 1px #00b38a">
    <path d="M 100 20 L 180 180 L 20 180 L 100 20" stroke="#00b38a" stroke-width="3" fill="none"/>
    <path d="M 100 0 L 100 200" stroke="red" stroke-width="1" stroke-dasharray=""/>
</svg>
两条线相交后会形成一个凹角:
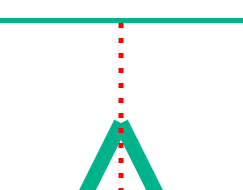
造成这种差异的原因在于线段与线段之间的连接方式会受到 stroke-linejoin 和 stroke-linecap 的影响。
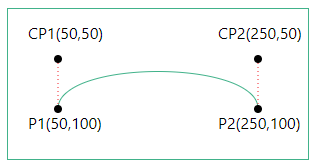
curveto
| 命令 | 参数 | 描述 |
|---|---|---|
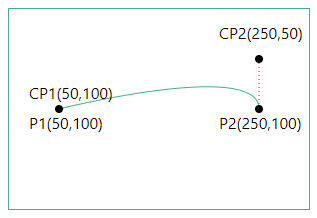
| C 或 c | (x1 y1 x2 y2 x y)+ | 使用(x1,y1)作为曲线起始点的控制点,使用(x2,y2)作为曲线结束点的控制点绘制从当前点到点(x,y)的三次贝塞尔曲线。 |
示例:
<svg width="300" height="150" xmlns="http://www.w3.org/2000/svg" version="1.2" style="border: solid 1px #00b38a">
    <path d="M 50 100 C 50 50 250 50 250 100" stroke="#00b38a" fill="none"/>
    <line x1="50" y1="50" x2="50" y2="100" stroke-width="1" stroke="red" stroke-dasharray="1,3"/>
    <line x1="250" y1="50" x2="250" y2="100" stroke-width="1" stroke="red" stroke-dasharray="1,3"/>
    <circle r="4" cx="50" cy="50"/>
    <circle r="4" cx="250" cy="50"/>
    <text x="20" y="30">CP1(50,50)</text>
    <text x="210" y="30">CP2(250,50)</text>
    <circle r="4" cx="50" cy="100"/>
    <circle r="4" cx="250" cy="100"/>
    <text x="20" y="120">P1(50,100)</text>
    <text x="210" y="120">P2(250,100)</text>
</svg>
得到的结果如下,CP1 和 CP2 为两个控制点:
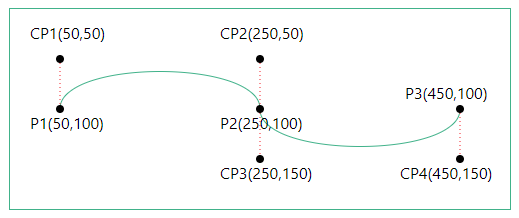
此命令也可以指定多组坐标,用于连续绘制曲线,每段曲线的结束点将自动成为下条曲线的起始点。
<svg width="500" height="200" xmlns="http://www.w3.org/2000/svg" version="1.2" style="border: solid 1px #00b38a">
    <path d="M 50 100 C 50 50 250 50 250 100 250 150 450 150 450 100" stroke="#00b38a" fill="none"/>
    <line x1="50" y1="50" x2="50" y2="100" stroke-width="1" stroke="red" stroke-dasharray="1,3"/>
    <line x1="250" y1="50" x2="250" y2="100" stroke-width="1" stroke="red" stroke-dasharray="1,3"/>
    <line x1="250" y1="100" x2="250" y2="150" stroke-width="1" stroke="red" stroke-dasharray="1,3"/>
    <line x1="450" y1="100" x2="450" y2="150" stroke-width="1" stroke="red" stroke-dasharray="1,3"/>
    <circle r="4" cx="50" cy="50"/>
    <circle r="4" cx="250" cy="50"/>
    <circle r="4" cx="250" cy="150"/>
    <circle r="4" cx="450" cy="150"/>
    <text x="20" y="30">CP1(50,50)</text>
    <text x="210" y="30">CP2(250,50)</text>
    <text x="210" y="170">CP3(250,150)</text>
    <text x="390" y="170">CP4(450,150)</text>
    <circle r="4" cx="50" cy="100"/>
    <circle r="4" cx="250" cy="100"/>
    <circle r="4" cx="450" cy="100"/>
    <text x="20" y="120">P1(50,100)</text>
    <text x="210" y="120">P2(250,100)</text>
    <text x="395" y="90">P3(450,100)</text>
</svg>
得到的结果如下:
smooth curveto
| 命令 | 参数 | 描述 |
|---|---|---|
| S 或 s | (x2 y2 x y)+ | 使用(x1,y1)作为曲线起点的控制点,使用(x2,y2)作为曲线终点的控制点绘制从当前点到(x,y)的三次贝塞尔曲线。 |
此命令是 curveto 命令的简写,它假定第一个控制点是第二个控制点相对于当前点在先前命令上的反射(可以理解为第一个控制点是第二个控制点相对于当前点的对称点),因此使用此命令时只需要指定第二个控制点的坐标 (x2,y2) 和结束点的坐标 (x,y)。
沿用之前的例子,修改第二组坐标:
<svg width="500" height="200" xmlns="http://www.w3.org/2000/svg" version="1.2" style="border: solid 1px #00b38a">
    <path d="M 50 100 C 50 50 250 50 250 100 S 450 150 450 100" stroke="#00b38a" fill="none"/>
    <line x1="50" y1="50" x2="50" y2="100" stroke-width="1" stroke="red" stroke-dasharray="1,3"/>
    <line x1="250" y1="50" x2="250" y2="100" stroke-width="1" stroke="red" stroke-dasharray="1,3"/>
    <line x1="250" y1="100" x2="250" y2="150" stroke-width="1" stroke="red" stroke-dasharray="1,3"/>
    <line x1="450" y1="100" x2="450" y2="150" stroke-width="1" stroke="red" stroke-dasharray="1,3"/>
    <circle r="4" cx="50" cy="50"/>
    <circle r="4" cx="250" cy="50"/>
    <circle r="4" cx="250" cy="150"/>
    <circle r="4" cx="450" cy="150"/>
    <text x="20" y="30">CP1(50,50)</text>
    <text x="210" y="30">CP2(250,50)</text>
    <text x="210" y="170">CP3(250,150)</text>
    <text x="390" y="170">CP4(450,150)</text>
    <circle r="4" cx="50" cy="100"/>
    <circle r="4" cx="250" cy="100"/>
    <circle r="4" cx="450" cy="100"/>
    <text x="20" y="120">P1(50,100)</text>
    <text x="210" y="120">P2(250,100)</text>
    <text x="395" y="90">P3(450,100)</text>
</svg>
得到的结果是一样的:
如果在它之前没有命令,或者先前的命令不是 C,c,S 或 s,则假定第一个控制点与当前点重合。
沿用之前的例子:
<svg width="300" height="200" xmlns="http://www.w3.org/2000/svg" version="1.2" style="border: solid 1px #00b38a">
    <path d="M 50 100 S 250 50 250 100" stroke="#00b38a" fill="none"/>
    <line x1="250" y1="50" x2="250" y2="100" stroke-width="1" stroke="red" stroke-dasharray="1,3"/>
    <circle r="4" cx="250" cy="50"/>
    <text x="20" y="90">CP1(50,100)</text>
    <text x="210" y="30">CP2(250,50)</text>
    <circle r="4" cx="50" cy="100"/>
    <circle r="4" cx="250" cy="100"/>
    <circle r="4" cx="450" cy="100"/>
    <text x="20" y="120">P1(50,100)</text>
    <text x="210" y="120">P2(250,100)</text>
</svg>
得到的结果如下:
此命令也可以指定多组坐标,用于连续绘制曲线,每段曲线的结束点将自动成为下条曲线的起始点。
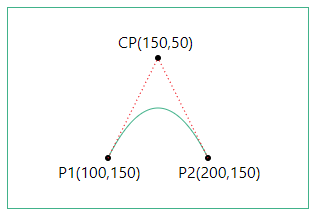
quadratic Bézier curveto
| 命令 | 参数 | 描述 |
|---|---|---|
| Q 或 q | (x1 y1 x y)+ | 使用(x1,y1)作为曲线起点的控制点,使用(x2,y2)作为曲线终点的控制点绘制从当前点到(x,y)的三次贝塞尔曲线。 |
示例:
<svg width="300" height="200" xmlns="http://www.w3.org/2000/svg" version="1.2" style="border: solid 1px #00b38a">
    <path d="M 100 150 Q 150 50 200 150" stroke="#00b38a" fill="none"/>
    <circle r="3" cx="100" cy="150"/>
    <circle r="3" cx="200" cy="150"/>
    <circle r="3" cx="150" cy="50"/>
    <line x1="100" y1="150" x2="150" y2="50" stroke="red" stroke-dasharray="1,3"/>
    <line x1="200" y1="150" x2="150" y2="50" stroke="red" stroke-dasharray="1,3"/>
    <text x="110" y="40">CP(150,50)</text>
    <text x="50" y="170">P1(100,150)</text>
    <text x="170" y="170">P2(200,150)</text>
</svg>
得到的结果如下:
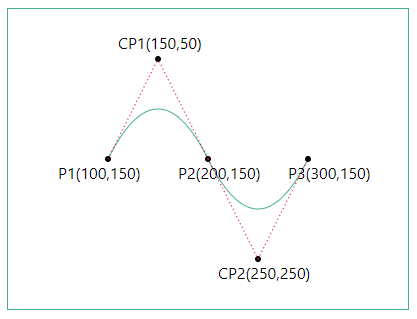
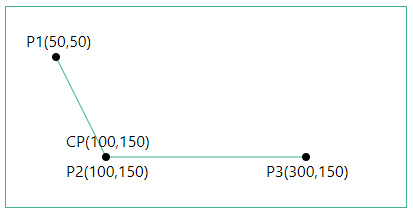
它也可以指定多组坐标,用于连续绘制曲线,每段曲线的结束点将自动成为下条曲线的起始点。
<svg width="400" height="300" xmlns="http://www.w3.org/2000/svg" version="1.2" style="border: solid 1px #00b38a">
    <path d="M 100 150 Q 150 50 200 150 250 250 300 150" stroke="#00b38a" fill="none"/>
    <circle r="3" cx="100" cy="150"/>
    <circle r="3" cx="200" cy="150"/>
    <circle r="3" cx="150" cy="50"/>
    <circle r="3" cx="250" cy="250"/>
    <circle r="3" cx="300" cy="150"/>
    <line x1="100" y1="150" x2="150" y2="50" stroke="red" stroke-dasharray=""/>
    <line x1="200" y1="150" x2="150" y2="50" stroke="red" stroke-dasharray=""/>
    <line x1="200" y1="150" x2="250" y2="250" stroke="red" stroke-dasharray=""/>
    <line x1="250" y1="250" x2="300" y2="150" stroke="red" stroke-dasharray=""/>
    <text x="110" y="40">CP1(150,50)</text>
    <text x="50" y="170">P1(100,150)</text>
    <text x="170" y="170">P2(200,150)</text>
    <text x="210" y="270">CP2(250,250)</text>
    <text x="280" y="170">P4(300,150)</text>
</svg>
得到的结果如下:
smooth quadratic Bézier curveto
| 命令 | 参数 | 描述 |
|---|---|---|
| T 或 t | (x y)+ | 使用(x1,y1)作为曲线起点的控制点,使用(x2,y2)作为曲线终点的控制点绘制从当前点到(x,y)的三次贝塞尔曲线。 |
此命令是 quadratic Bézier curveto 命令的简写,它假定新控制点是控制点在上一个命令中相对于当前点的反射(可以理解为新控制点是前一个命令中的控制点相对于当前点的对称点),因此使用时只需指定结束点坐标 (x,y) 即可。
沿用之前的例子:
<svg width="400" height="300" xmlns="http://www.w3.org/2000/svg" version="1.2" style="border: solid 1px #00b38a">
    <path d="M 100 150 Q 150 50 200 150 T 300 150" stroke="#00b38a" fill="none"/>
    <circle r="3" cx="100" cy="150"/>
    <circle r="3" cx="200" cy="150"/>
    <circle r="3" cx="150" cy="50"/>
    <circle r="3" cx="250" cy="250"/>
    <circle r="3" cx="300" cy="150"/>
    <line x1="100" y1="150" x2="150" y2="50" stroke="red" stroke-dasharray="1,3"/>
    <line x1="200" y1="150" x2="150" y2="50" stroke="red" stroke-dasharray="1,3"/>
    <line x1="200" y1="150" x2="250" y2="250" stroke="red" stroke-dasharray="1,3"/>
    <line x1="250" y1="250" x2="300" y2="150" stroke="red" stroke-dasharray="1,3"/>
    <text x="110" y="40">CP1(150,50)</text>
    <text x="50" y="170">P1(100,150)</text>
    <text x="170" y="170">P2(200,150)</text>
    <text x="210" y="270">CP2(250,250)</text>
    <text x="280" y="170">P3(300,150)</text>
</svg>
将路径数据中的最后一个命令改为 T,得到的结果是一样的:
如果在它之前没有命令,或者之前的命令不是 Q,q,T 或 t,则假定控制点与当前点重合,其结果就是得到一条直线。
<svg width="400" height="200" xmlns="http://www.w3.org/2000/svg" version="1.2" style="border: solid 1px #00b38a">
    <path d="M 50 50 L 100 150 T 300 150" stroke="#00b38a" fill="none"/>
    <circle r="4" cx="50" cy="50"/>
    <circle r="4" cx="100" cy="150"/>
    <circle r="4" cx="300" cy="150"/>
    <text x="20" y="40">P1(50,50)</text>
    <text x="60" y="170">P2(100,150)</text>
    <text x="60" y="140">CP(100,150)</text>
    <text x="260" y="170">P3(300,150)</text>
</svg>
去掉中间的 Q 命令后,结果如下:
elliptical arc
| 命令 | 参数 | 描述 |
|---|---|---|
| A 或 a | (rx ry x-axis-rotation large-arc-flag sweep-flag x y)+ | 从当前点向结束点 (x,y) 绘制一段椭圆弧,椭圆的大小和方向由两个半径 (rx,ry) 和 x 轴旋转量(x-axis-rotation)定义,x 轴旋转量指示椭圆整体如何相对于当前坐标系旋转。椭圆的中心 (cx,cy) 是自动计算的,以满足其他参数施加的约束。large-arc-flag 和 sweep-flag 有助于自动计算,并帮助确定如何绘制弧 |
在任意两点间用此命令画弧时,都存在以下四种绘制方式:
<svg width="400" height="300" xmlns="http://www.w3.org/2000/svg" version="1.2" style="border: solid 1px #00b38a">
    <path d="M 100 150 A 150 50 0 1 1 300 150" stroke="red" stroke-width="1" fill="none"/>
    <path d="M 100 150 A 150 50 0 0 0 300 150" stroke="red" stroke-width="1" fill="none"/>
    <path d="M 100 150 A 150 50 0 1 0 300 150" stroke="blue" stroke-width="1" fill="none"/>
    <path d="M 100 150 A 150 50 0 0 1 300 150" stroke="blue" stroke-width="1" fill="none"/>
    <circle cx="100" cy="150" r="5"/>
    <circle cx="300" cy="150" r="5"/>
    <text x="60" y="170">P1(100,150)</text>
    <text x="260" y="170">P2(300,150)</text>
</svg>
四种绘制方式对应四段圆弧,两个椭圆:
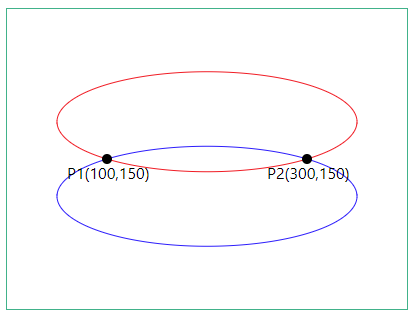
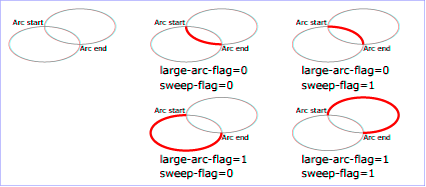
蓝色的椭圆和红色的椭圆与两点相交后各自都会形成一大一小两段圆弧,弧度大于等于 180 度的圆弧称为大弧(large-arc),弧度小于等于 180 度的圆弧称为小弧(small-arc)。因此使用此命令画弧时就有四种形式的圆弧可供选择,通过 elliptical arc 命令的 large-arc-flag 和 sweep-flag 参数可以选择使用哪种圆弧,它们的组合原则为:
- 如果
large-arc-flag为 1,则在两段大弧中选择;如果large-arc-flag为 0,则在两段小弧中选择。 - 如果
sweep-flag为 1,则弧线将沿正角方向绘制;如果sweep-flag为 0,则弧线将沿负角方向绘制。
W3 文档中的这张图充分展现了这种组合机制:
谈一谈我如何理解这里的正角方向和负角方向,百度百科中对于正角和负角的解释是:在平面内角的终边绕角的顶点旋转时,可以有两个不同的方向,一个是逆时针方向,一个是顺时针方向,沿逆时针方向旋转生成的角规定为正角;沿顺时针方向旋转生成的角则规定为负角。
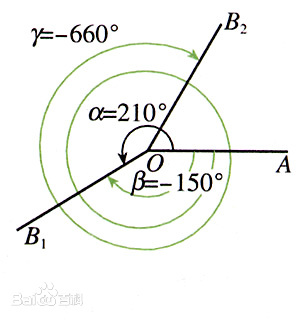
图中的 ∠γ 和 ∠β 为负角,∠α 为正角。如果我们从起始点画一条射线穿过结束点,将这条射线按逆时针方向旋转形成的角就是正角,将这条射线按顺时针方向旋转形成的角就是负角。
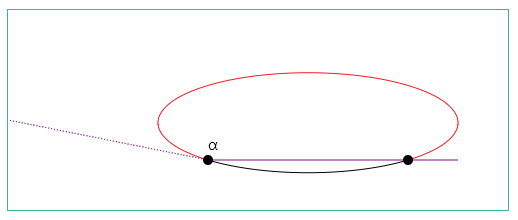
因此,当 large-arc-flag 为 1、sweep-flag 为 1 时,:
<svg width="500" height="200" xmlns="http://www.w3.org/2000/svg" version="1.2" style="border: solid 1px #00b38a">
    <path d="M 200 150 A 150 50 0 0 0 400 150 " fill="none" stroke="black"/>
    <path d="M 200 150 A 150 50 0 1 1 400 150" fill="none" stroke="red"/>
    <line x1="200" y1="150" x2="450" y2="150" stroke="purple"/>
    <line x1="200" y1="150" x2="0" y2="110" stroke="purple" stroke-dasharray="1,2"/>
    <circle cx="200" cy="150" r="5" fill=""/>
    <circle cx="400" cy="150" r="5" fill=""/>
    <text x="200" y="140">α</text>
</svg>
取大弧,按正角 α(紫色实线按逆时针方向旋转到紫色虚线时形成的夹角)方向,得到红色弧线:
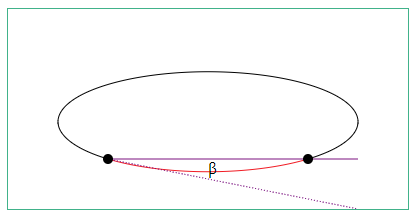
当 large-arc-flag 为 0、sweep-flag 为 0 时:
<svg width="400" height="200" xmlns="http://www.w3.org/2000/svg" version="1.2" style="border: solid 1px #00b38a">
    <path d="M 100 150 A 150 50 0 0 0 300 150 " fill="none" stroke="red"/>
    <path d="M 100 150 A 150 50 0 1 1 300 150" fill="none" stroke="black"/>
    <line x1="100" y1="150" x2="350" y2="150" stroke="purple"/>
    <line x1="100" y1="150" x2="350" y2="200" stroke="purple" stroke-dasharray="1,2"/>
    <circle cx="100" cy="150" r="5" fill=""/>
    <circle cx="300" cy="150" r="5" fill=""/>
    <text x="200" y="165">β</text>
</svg>
取小弧,按负角 β(紫色实线按顺时针方向旋转到紫色虚线时形成的夹角)方向,得到红色弧线:
x-axis-rotation 的值可正可负,单位是角度,正值按顺时针方向旋转,负值按逆时针方向旋转。沿用之前的示例,将 x-axis-rotation 的值设为 30 时:
<svg width="400" height="300" xmlns="http://www.w3.org/2000/svg" version="1.2" style="border: solid 1px #00b38a">
    <path d="M 100 150 A 150 50 0 0 0 300 150 " fill="none" stroke="black"/>
    <path d="M 100 150 A 150 50 0 1 1 300 150" fill="none" stroke="black"/>
    <path d="M 100 150 A 150 50 30 0 0 300 150 " fill="none" stroke="red"/>
    <path d="M 100 150 A 150 50 30 1 1 300 150 " fill="none" stroke="red"/>
    <circle cx="100" cy="150" r="5" fill=""/>
    <circle cx="300" cy="150" r="5" fill=""/>
</svg>
得到的图案如下(红色线条为旋转后的效果):
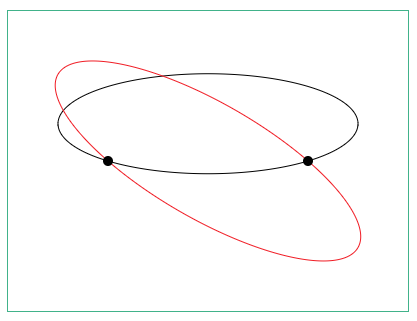
需要特别注意的是,x-axis-rotation 的旋转是相对于当前坐标系的,坐标系的不同会影响到最终效果。
通常很少使用此命令绘制曲线,因为它的参数较多,使用起来比较麻烦。
pathLength
在实际生活中,SVG 会运行在不同的设备上,但每种设备对于路径长度的精度设定并不完全相同,因此,当使用者希望一幅 SVG 画作在不同设备上都能呈现相同的效果时,就需要针对设备做精度调整(当然,也并不能满足所有情况),此属性的功能就在于此。此属性允许使用者以用户单位指定路径的总长度,设备将按 pathLength 与设备自己的总路径长度计算值之比来进行缩放。
来看一个例子:
<svg width="400" height="250" xmlns="http://www.w3.org/2000/svg" version="1.2" style="border: solid 1px #00b38a">
    <path d="M 50 50 L 350 50" fill="none" stroke-width="3" stroke-dasharray="1" stroke="red"/>
    <path d="M 50 100 L 350 100" fill="none" pathLength="150" stroke-width="3" stroke-dasharray="1" stroke="red"/>
    <path d="M 50 150 L 350 150" fill="none" pathLength="50" stroke-width="3" stroke-dasharray="1" stroke="red"/>
    <path d="M 50 200 L 350 200" fill="none" pathLength="10" stroke-width="3" stroke-dasharray="1" stroke="red"/>
</svg>
以上代码绘制了四条虚线,它们的起始点和结束点都相同,得到的结果如下:
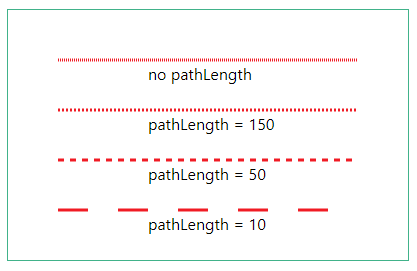
每条线段的总长度都是 300px(本文所有示例均使用像素为默认单位),通过指定 pathLength,将四条线的长度分别设定为 150px、50px 和 10px,可以看到虚线的绘制长度与间隔越来越大。
结语
根据文中所有的内容可以看出,SVG 的绘制还是很复杂的,尤其是在自定义形状时。通常建议大家使用 SVG 编辑器来帮助完成工作,它的可视化操作方式让我们可以很直观的看到每一步操作的变化,只有当你想得到一个非常精确的图形时,代码也许才是更佳的选择,当然,工作需要的情况除外。
严格来说,文中所涉及的直线、曲线、圆弧等都是指的线段,因为它们都是有两个端点的。